Backtesting a Strategy
Backtesting lets you run your strategy against historical market data before you deploy it to a live exchange. The results appear as a node on the canvas so you can see how your automated trading strategy would have performed historically.
How it works
When you run a backtest, the Strategy Builder:
- Takes the current strategy graph from the canvas
- Fetches historical price and indicator data for the time range
- Replays the strategy through that data, simulating fills at historical prices
- Shows the results in a Backtest Result node
Backtesting is good for validating logic and comparing setups, but it can’t fully reproduce live execution. The limitations section below covers the gaps.
A backtest shows how your logic would have behaved under past conditions. It never guarantees future results, so treat a strong backtest as a reason to test further rather than a reason to size up.
Running a backtest
- Build or load your strategy on the canvas.
- Click Backtest in the floating toolbar.
- The builder prepares the historical data range and runs the simulation.
- A Backtest Result node appears on the canvas with the outcome.
If the strategy graph has validation errors, the backtest will not run. Fix any flagged issues first.
Execution assumptions and date range
Before you run, a settings popover lets you set two things that shape the result: what the fills cost, and which slice of history you test against. Open it with the chevron next to the Backtest button in the floating toolbar.
Fee % and Slippage %
Two fields, Fee (%) and Slippage (%), set the cost the simulation applies to each fill. Fee is the trading fee charged per fill. Slippage is the price concession the simulation assumes between the signal and the fill. Both accept up to four decimal places.
Both default to 0. A default backtest therefore runs frictionless: no fees, no slippage, the cleanest possible version of your logic. That is fine for a first read of whether the idea works at all, but it flatters the result. Set a realistic fee and slippage before you trust a number you would size on, so the simulation carries the costs a live order actually pays.
Historical window
The same popover picks the window the backtest runs over. Presets cover the common cases: Recent (the default lookback), Last 7 days, Last 30 days, Last 90 days, Last 180 days, and Last year. Choose a non-default preset and the Backtest button shows it, for example Backtest · 30D, so you always know which window you are testing.
For anything else, choose Custom range and set From and To with the date-and-time pickers. A custom range defaults to the last 30 days. The To date must be after the From date. If it is not, the panel flags “From must be before To.” and holds the run until you fix it.
Avoid judging the strategy on a single stretch of history, whether quiet or violent. Test more than one regime, as the Tips below spell out.
Reading the results
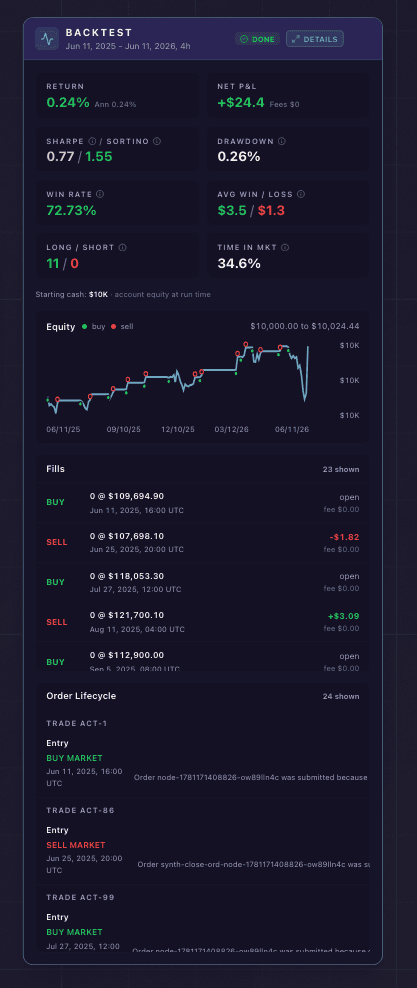
A Backtest Result node: the performance tiles, the equity curve, and every simulated fill.
The Backtest Result node shows a set of metric tiles:
| Metric | What it means |
|---|---|
| Return | Total percentage gain or loss across all simulated trades |
| Net P&L | Profit or loss in USD, with fees paid shown beneath it |
| Sharpe | Risk-adjusted return. Above 1 is generally considered good |
| Sortino | Like Sharpe, but only the downside (harmful) volatility counts against it. Higher is better |
| Drawdown | Largest peak-to-trough decline during the backtest period |
| Win Rate | Percentage of trades that were profitable |
| Avg Win / Loss | The average winning trade against the average losing trade |
| Long / Short | How many trades were long versus short |
| Time in Market | The share of the period the strategy held a position |
Open the expanded view for the full summary, which adds:
- Equity curve: The simulated portfolio value from start to end, with a marker on each trade. The starting cash is your account equity at run time, or a default of 10,000 when that is not available
- Annualized: Return projected to a full year, shown beneath the Return tile
- Fills: A list of every simulated trade with side (buy/sell), size, price, fee, realized PnL on closes, and timestamp
Partial results
If some historical data is missing or the output is truncated to fit display limits, the result node shows a Partial badge with a warning message. The metrics are still useful, but the fill list may be incomplete.
Limitations
Backtests simulate fills at historical prices. They apply the fee and slippage assumptions you set and report the resulting cost, but they cannot reproduce live order-book depth, latency, or market impact. A backtest assumes your order fills at a historical candle. A live order competes for real liquidity at that moment.
Historical indicator values are computed from historical data, not live feeds. This is usually accurate but can differ slightly from real-time computation during fast markets.
The backtest runs against the current canvas state. If you modify the strategy after running a backtest, the result node reflects the old version until you run it again.
Tips
Backtest before deploying any new strategy. It catches logical errors a glance at the canvas misses, like impossible conditions or a misconfigured cycle. Configure your stop loss and take profit first, so the simulation includes the risk management that will run live.
Compare backtest results across different time ranges to see how the strategy behaves in different market regimes: a setup that thrives in a trend can bleed in a chop.
Delete old backtest result nodes to keep the canvas clean. Click the X on the node header.
Next steps
Once the backtest looks good, do not size up on that one number. Optimize the strategy to sweep its parameters and stress-test the result out of sample, so a strong backtest is a number you can trust rather than one you tuned your way into.
When the logic survives that, deploying to live markets is the next step. After it has run for a while and built a real record, you can share the result as a card with the strategy’s stats on it.