Monitor a Live Strategy
A deployed strategy trades with your funds behind it, so watch how it actually behaves. Once a strategy is deployed, you track its progress from the strategy dashboard on the left side of the canvas. This page explains what the dashboard shows, how to read the canvas in view mode, and how to tell a waiting strategy from a stuck one.
Open the dashboard
Navigate to the Strategies section of the trading interface. The dashboard lists all your strategies, both active and historical.
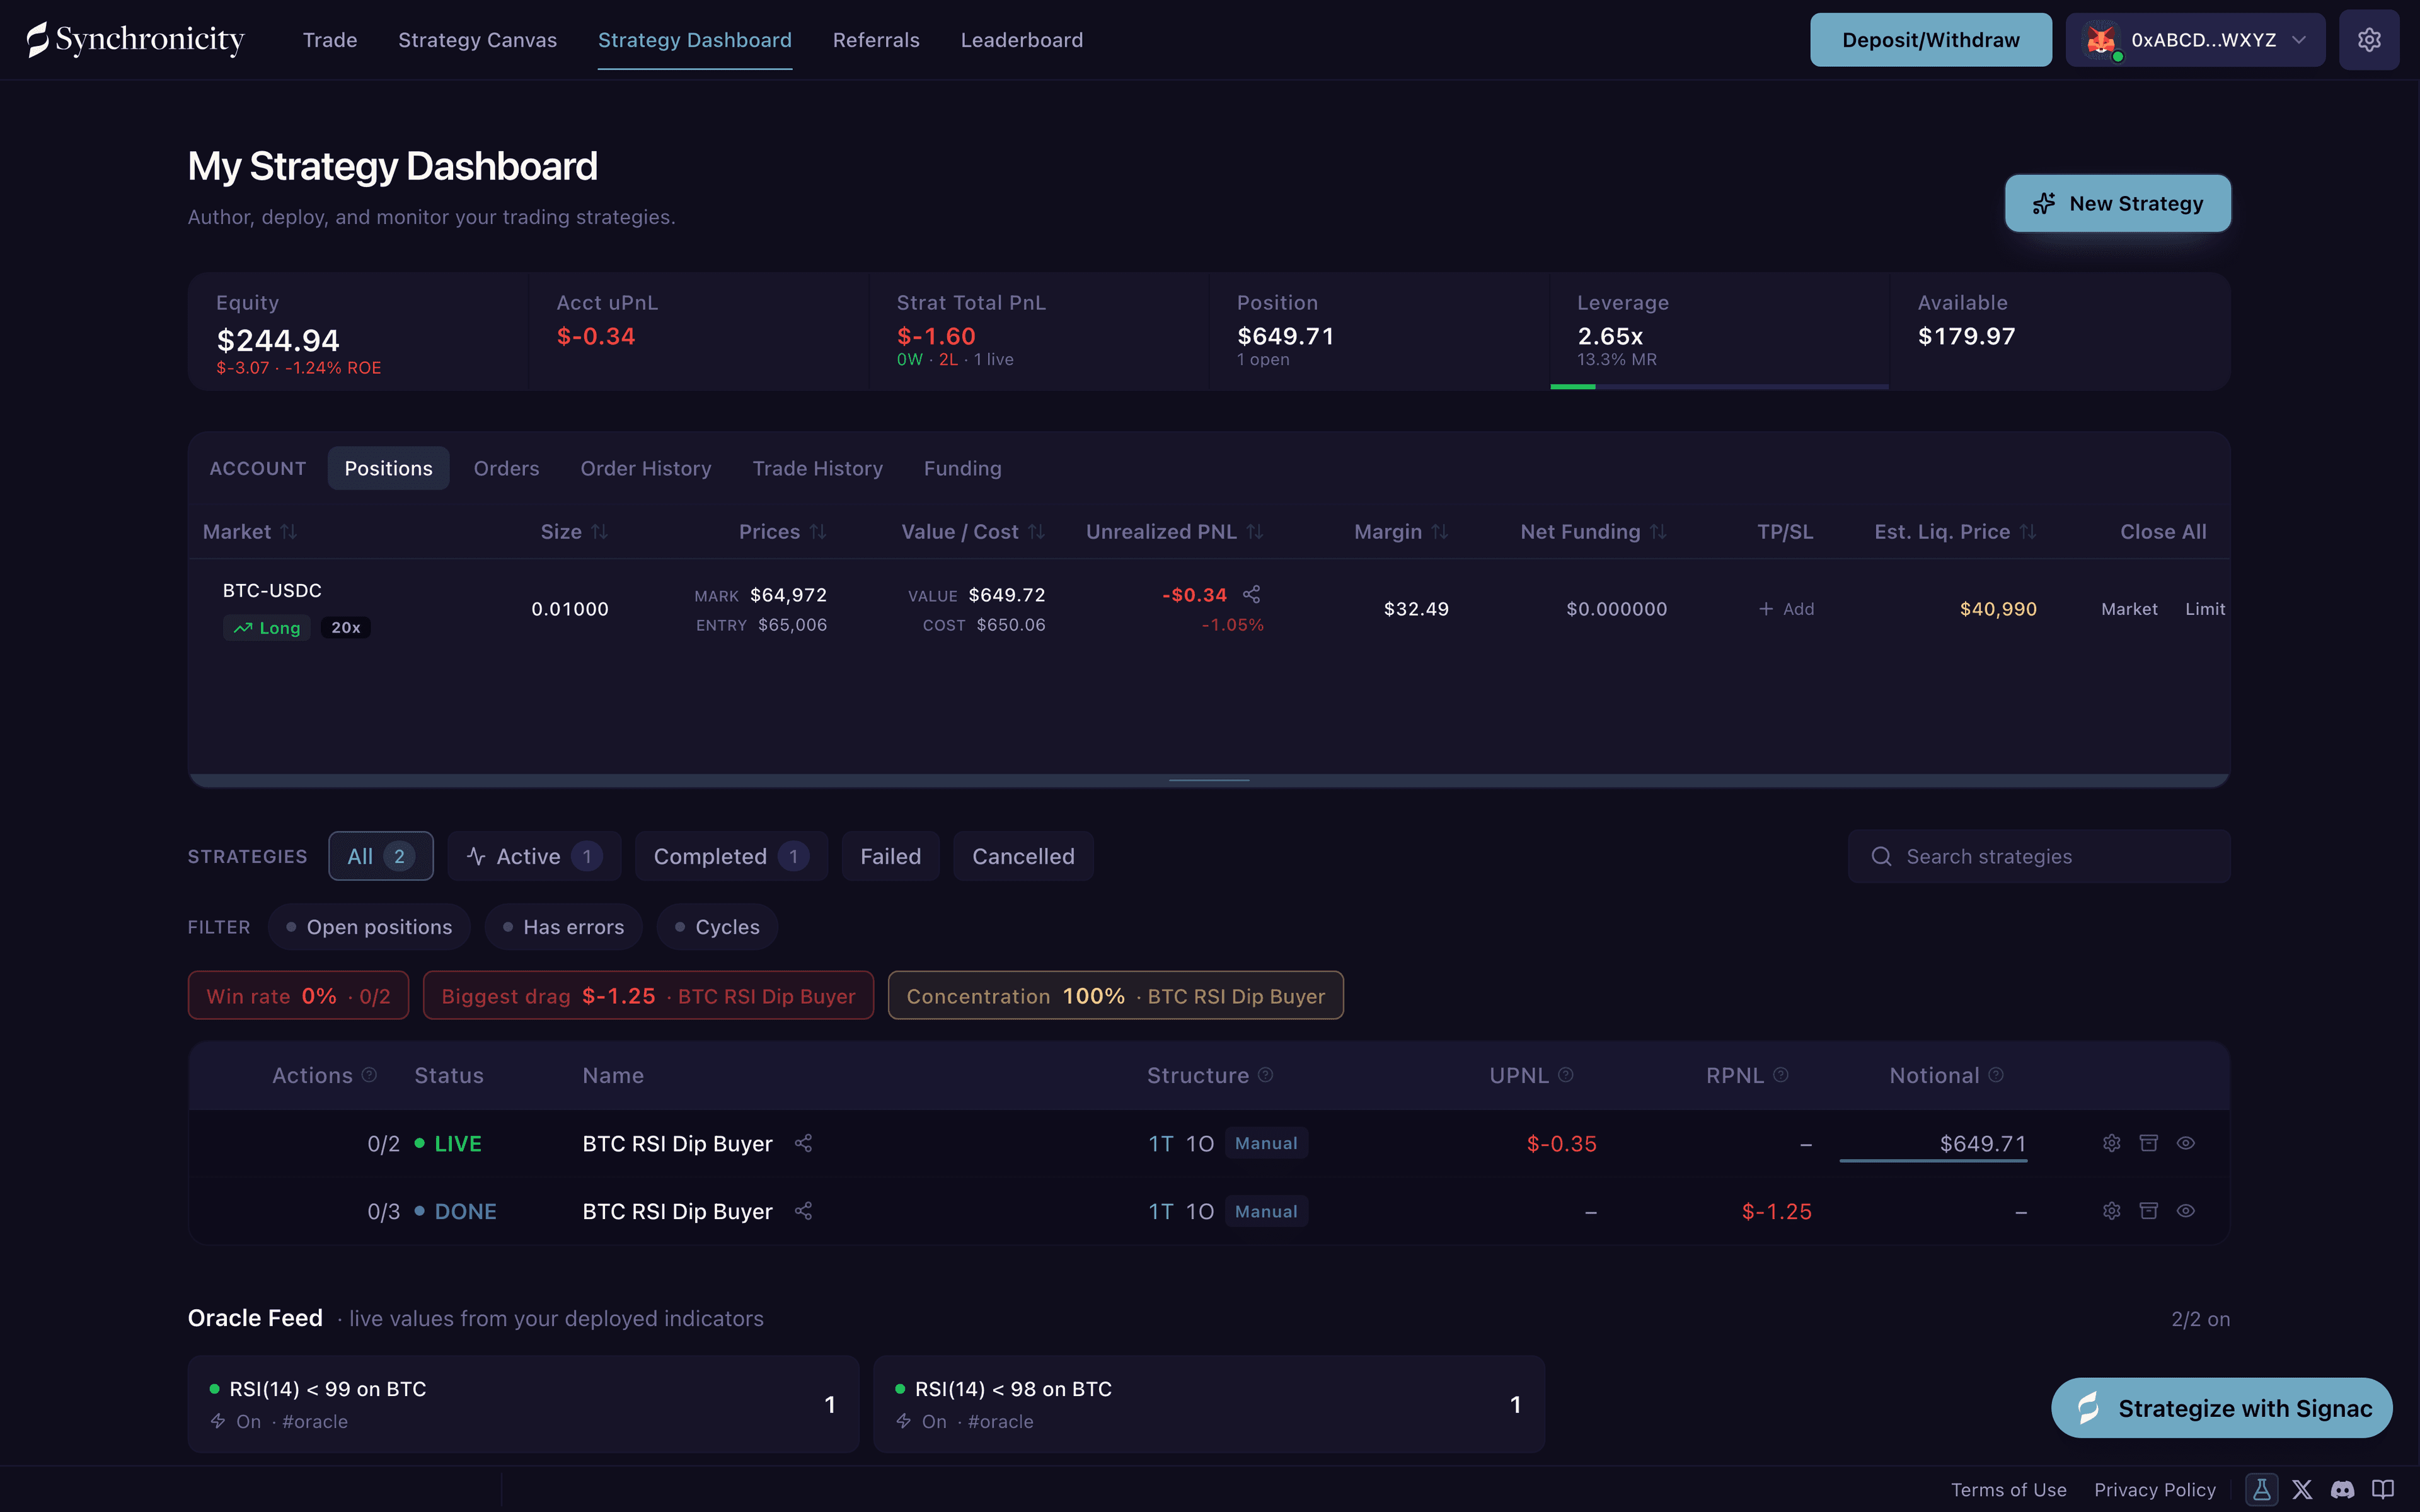
A live dashboard: account equity and uPnL up top, a running strategy row, and the Oracle Feed.
Filter by status:
- Active: Currently running strategies.
- Done: Completed strategies, all nodes ran successfully to the end of the flow.
- Failed: Strategies that stopped because a node could not complete.
- Off: Strategies you stopped manually. Off is the filter’s label, but the strategy itself carries the status Cancelled, and that is the word on its card and everywhere else. Cancel or Stop a Strategy covers how a strategy gets there.
Strategy card overview
Each strategy in the list shows:
- Name and status indicator: A colored dot reflects current status. Blue for active, gold for completed, red for failed or cancelled.
- Exposure: Total value of open positions.
- uPnL: Unrealized PnL on any open positions held by the strategy.
- rPnL: Realized PnL booked by the strategy.
Click a strategy to expand it or open it in the canvas viewer.
Reading the canvas in view mode
Clicking into a deployed strategy opens the canvas in read-only view mode, showing the strategy’s current execution state. The floating toolbar at the top shows the strategy’s overall status.
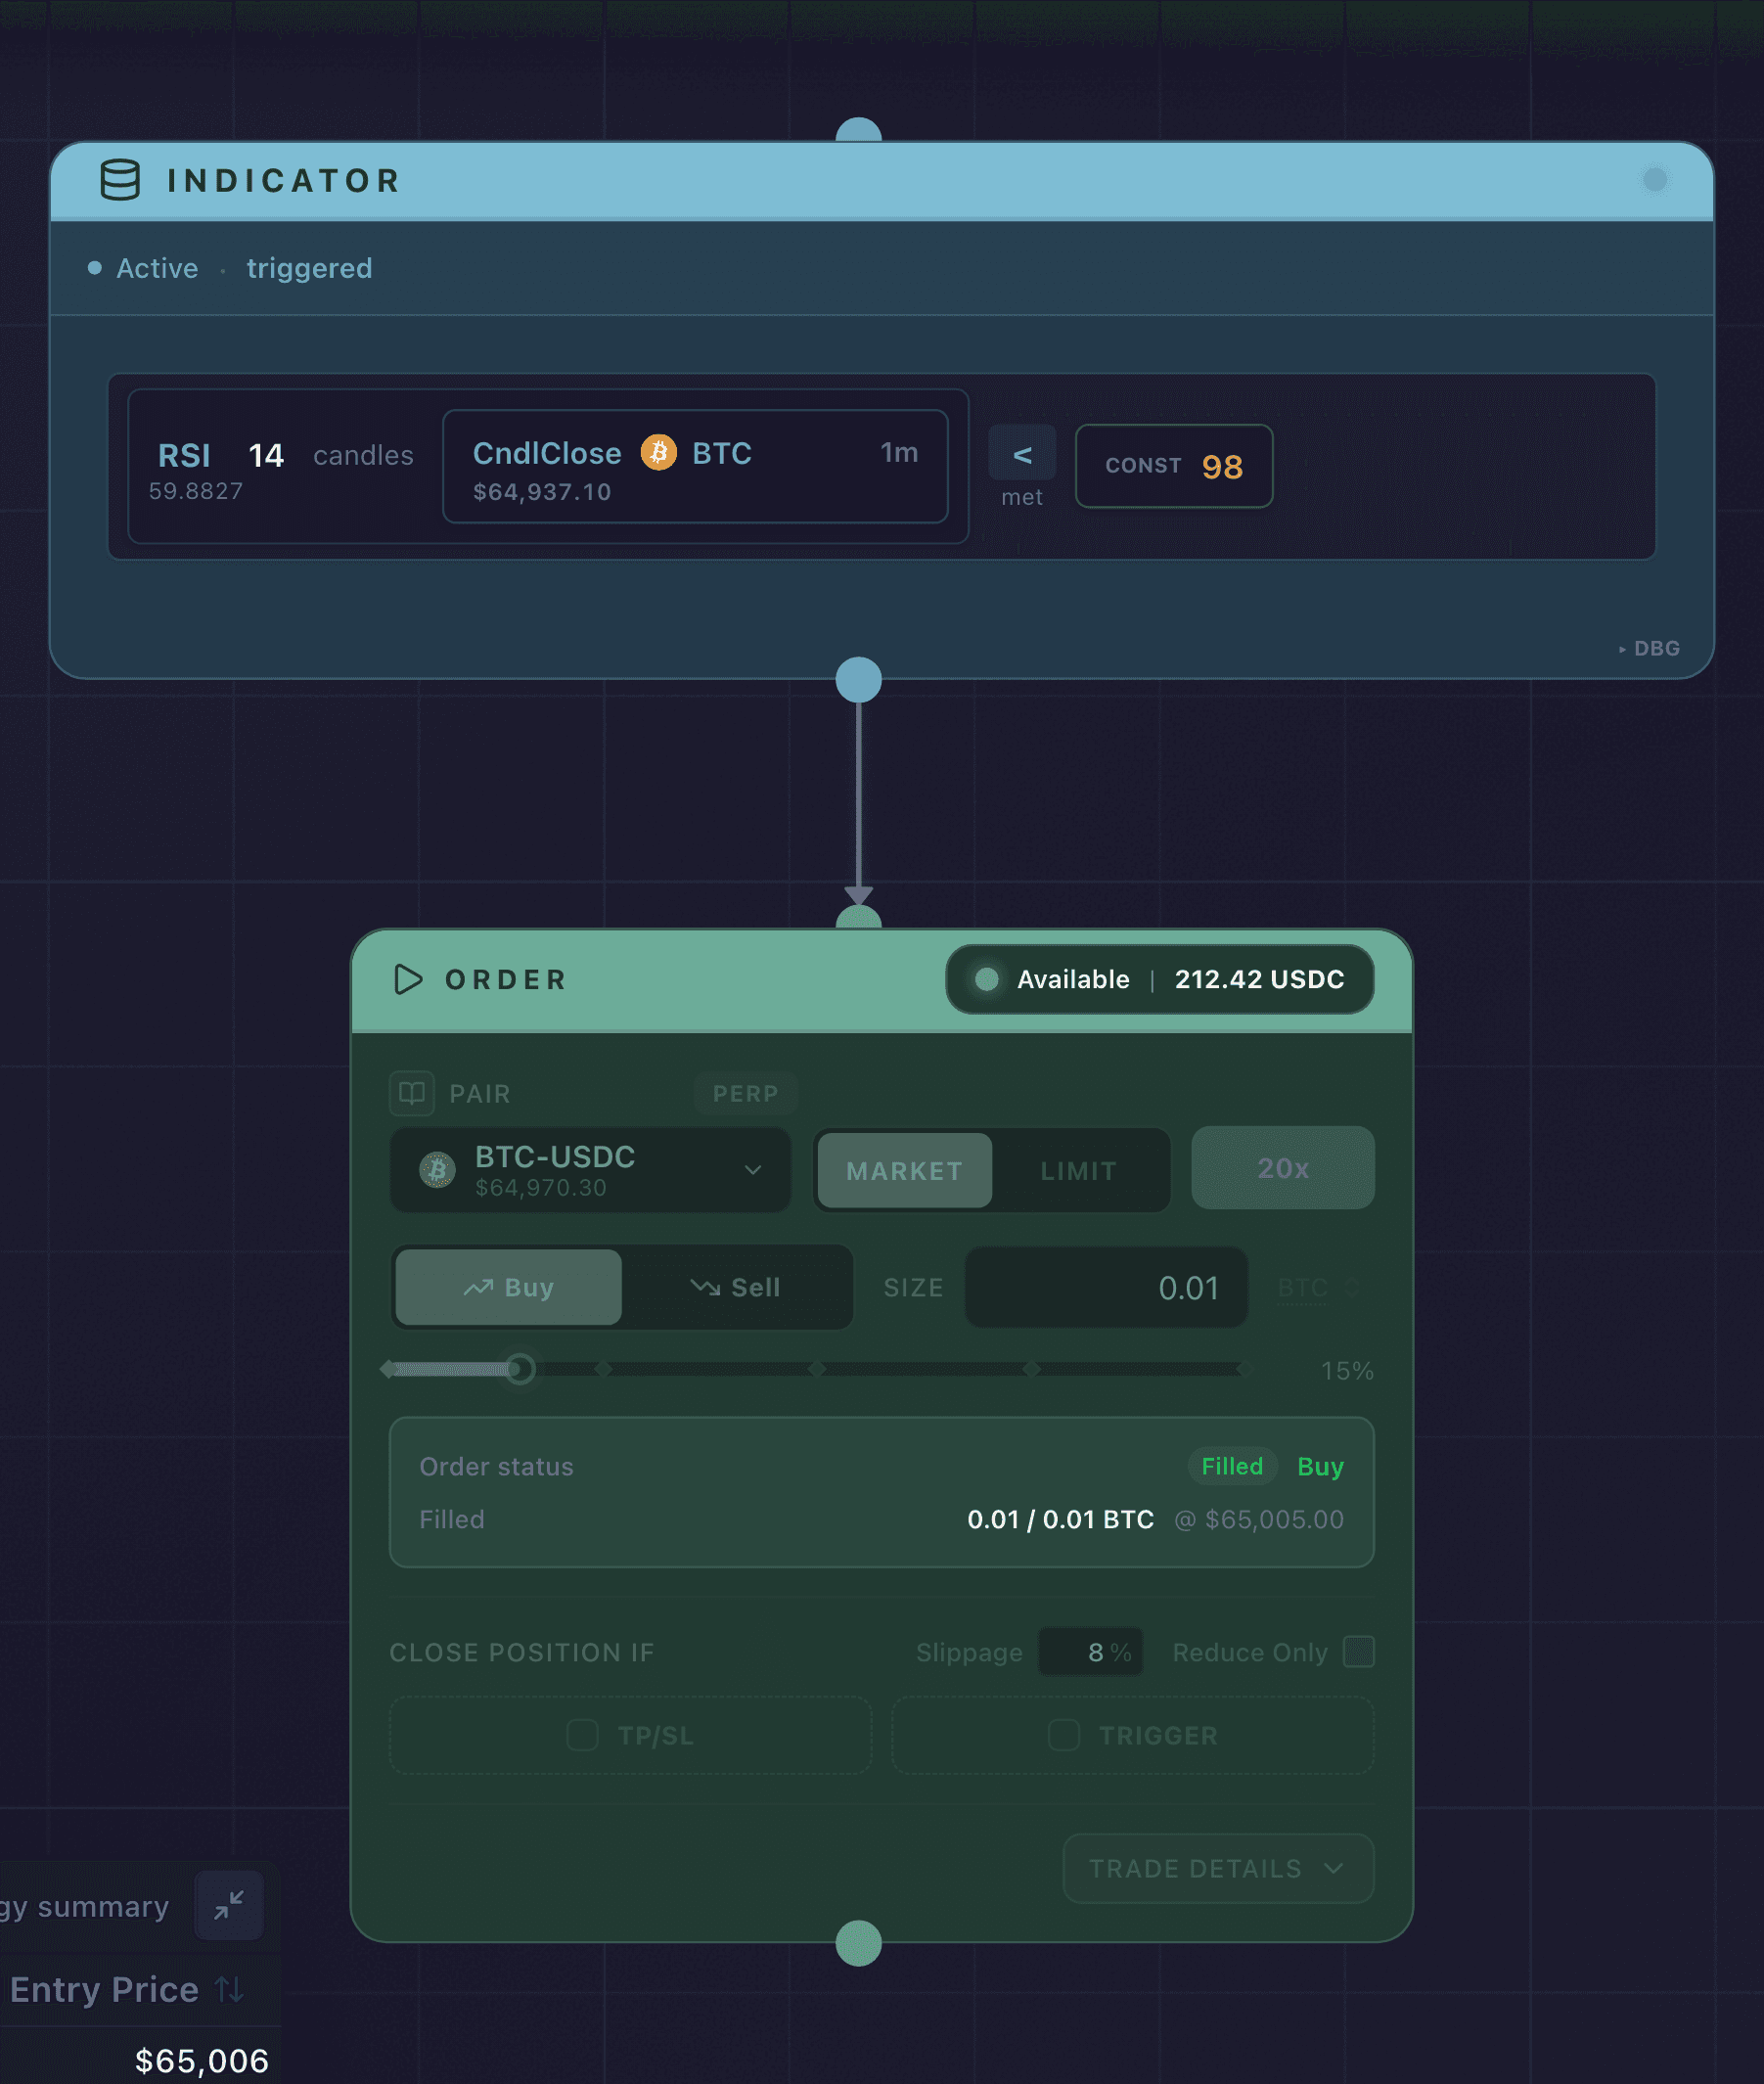
The read-only canvas of a running strategy: the Indicator triggered, and the Order filled.
Node highlighting:
- Active node: The node the strategy is currently waiting on or executing. Highlighted to show exactly where the strategy is in the flow.
- Failed node: A node that encountered an error and could not complete. Shown with a distinct indicator.
This view is useful for understanding where a strategy is stuck or why it stopped earlier than expected.
If a strategy is not doing what you expected, open it in view mode and find the highlighted node. A highlighted Indicator means the strategy is waiting for its condition, which is normal. A node marked as failed is where to start debugging. Troubleshooting & FAQ covers the common stalls.
Checking open positions
The strategy dashboard shows live PnL and position data for any positions currently open under your strategy. This updates in real time. For how Synchronicity attributes exposure to each strategy and how to close a position it holds, see Strategy Positions.
The account equity tile at the top of the dashboard carries a sub-line with your lifetime account profit or loss and your return on equity, measured against your net deposits. Both figures are mirrored from Hyperliquid, so they describe the whole account, including any trading you did outside your strategies.
Positions, fills, and PnL settle on Hyperliquid, so the exchange’s own interface is the authoritative record. The dashboard mirrors that state for the positions your strategy holds. When a number has to be exact, check it against your Hyperliquid positions panel. If a strategy could not close a position, see Closing a position and reduce-only orders.
Watching cycle progress
If your strategy uses cycles, the dashboard tracks how many cycles have completed and how many remain. The cycle count updates as the strategy progresses. Each cycle resets from the first node.
Active versus still running
A strategy with Active status has been deployed and has not finished or been cancelled. It may currently be:
- Waiting for its trigger condition to be met
- Executing an order
- Monitoring an open position for an exit condition
All of these fall under Active. A strategy does not move to Done until its final node successfully completes and the flow ends. If a node fails, the strategy stays Active only while another branch is still running. Otherwise it moves to Failed.
When Synchronicity cannot reach Hyperliquid
If Synchronicity loses its connection to Hyperliquid, the dashboard tells you. A banner appears at the top naming the affected service, how long the outage has lasted, and how many of your strategies are degraded, paused, or failed because of it.
An outage does not fire your failure action on the spot. The engine handles it in stages, and an outage that clears before your timer runs out ends with your strategy running again untouched.
- It pauses first. When the required service goes unavailable, every affected strategy is paused automatically and starts waiting for the service to come back. A paused strategy places no new orders while it waits.
- It reconciles on recovery. When the service returns and stays healthy across several checks, the engine first reconciles the strategy’s positions against your real account state. That way the strategy resumes from what is actually true on Hyperliquid rather than from a stale picture taken before the outage.
- It resumes on its own. If recovery and reconciliation both complete before the outage timer’s deadline, the strategy returns to normal operation with no failure action taken. A short blip that clears in time lands here.
Only when an outage lasts past the timer you set does the failure action run. What happens then to the strategy’s positions and orders is decided by its failure settings. See Failure settings on the Deploy page for the options and the outage timer that governs when they trigger. Switch the timer off and an outage alone never trips the failure action, so a paused strategy waits for recovery for as long as it takes.
You are not locked into the failure settings you picked at deploy time. On the dashboard, open a strategy’s Strategy settings and click Modify to change its failure action and outage timer while it runs. The same options are covered under Failure settings.