Build Your First Trading Strategy
Once your wallet is connected and your Hyperliquid account is linked and funded (Connect to Hyperliquid), you are ready to build. This page takes you from that connected account to your first live strategy: open the Strategy Builder, describe a strategy to Signac in plain words, check what it built, backtest it, and deploy it to Hyperliquid.
Synchronicity is live on Hyperliquid mainnet, so a deployed strategy trades real funds at real risk. Size deliberately: the logic you deploy runs against your actual balance. To rehearse the same flow risk-free first, see Practice on Testnet.
Open the Strategy Builder
Go to the Strategy Builder. If you have no strategies yet, you see an empty state with a Create your first button: click it to open a new strategy on the canvas. The canvas is where you compose a strategy as nodes joined by connections, and where Signac works alongside you.
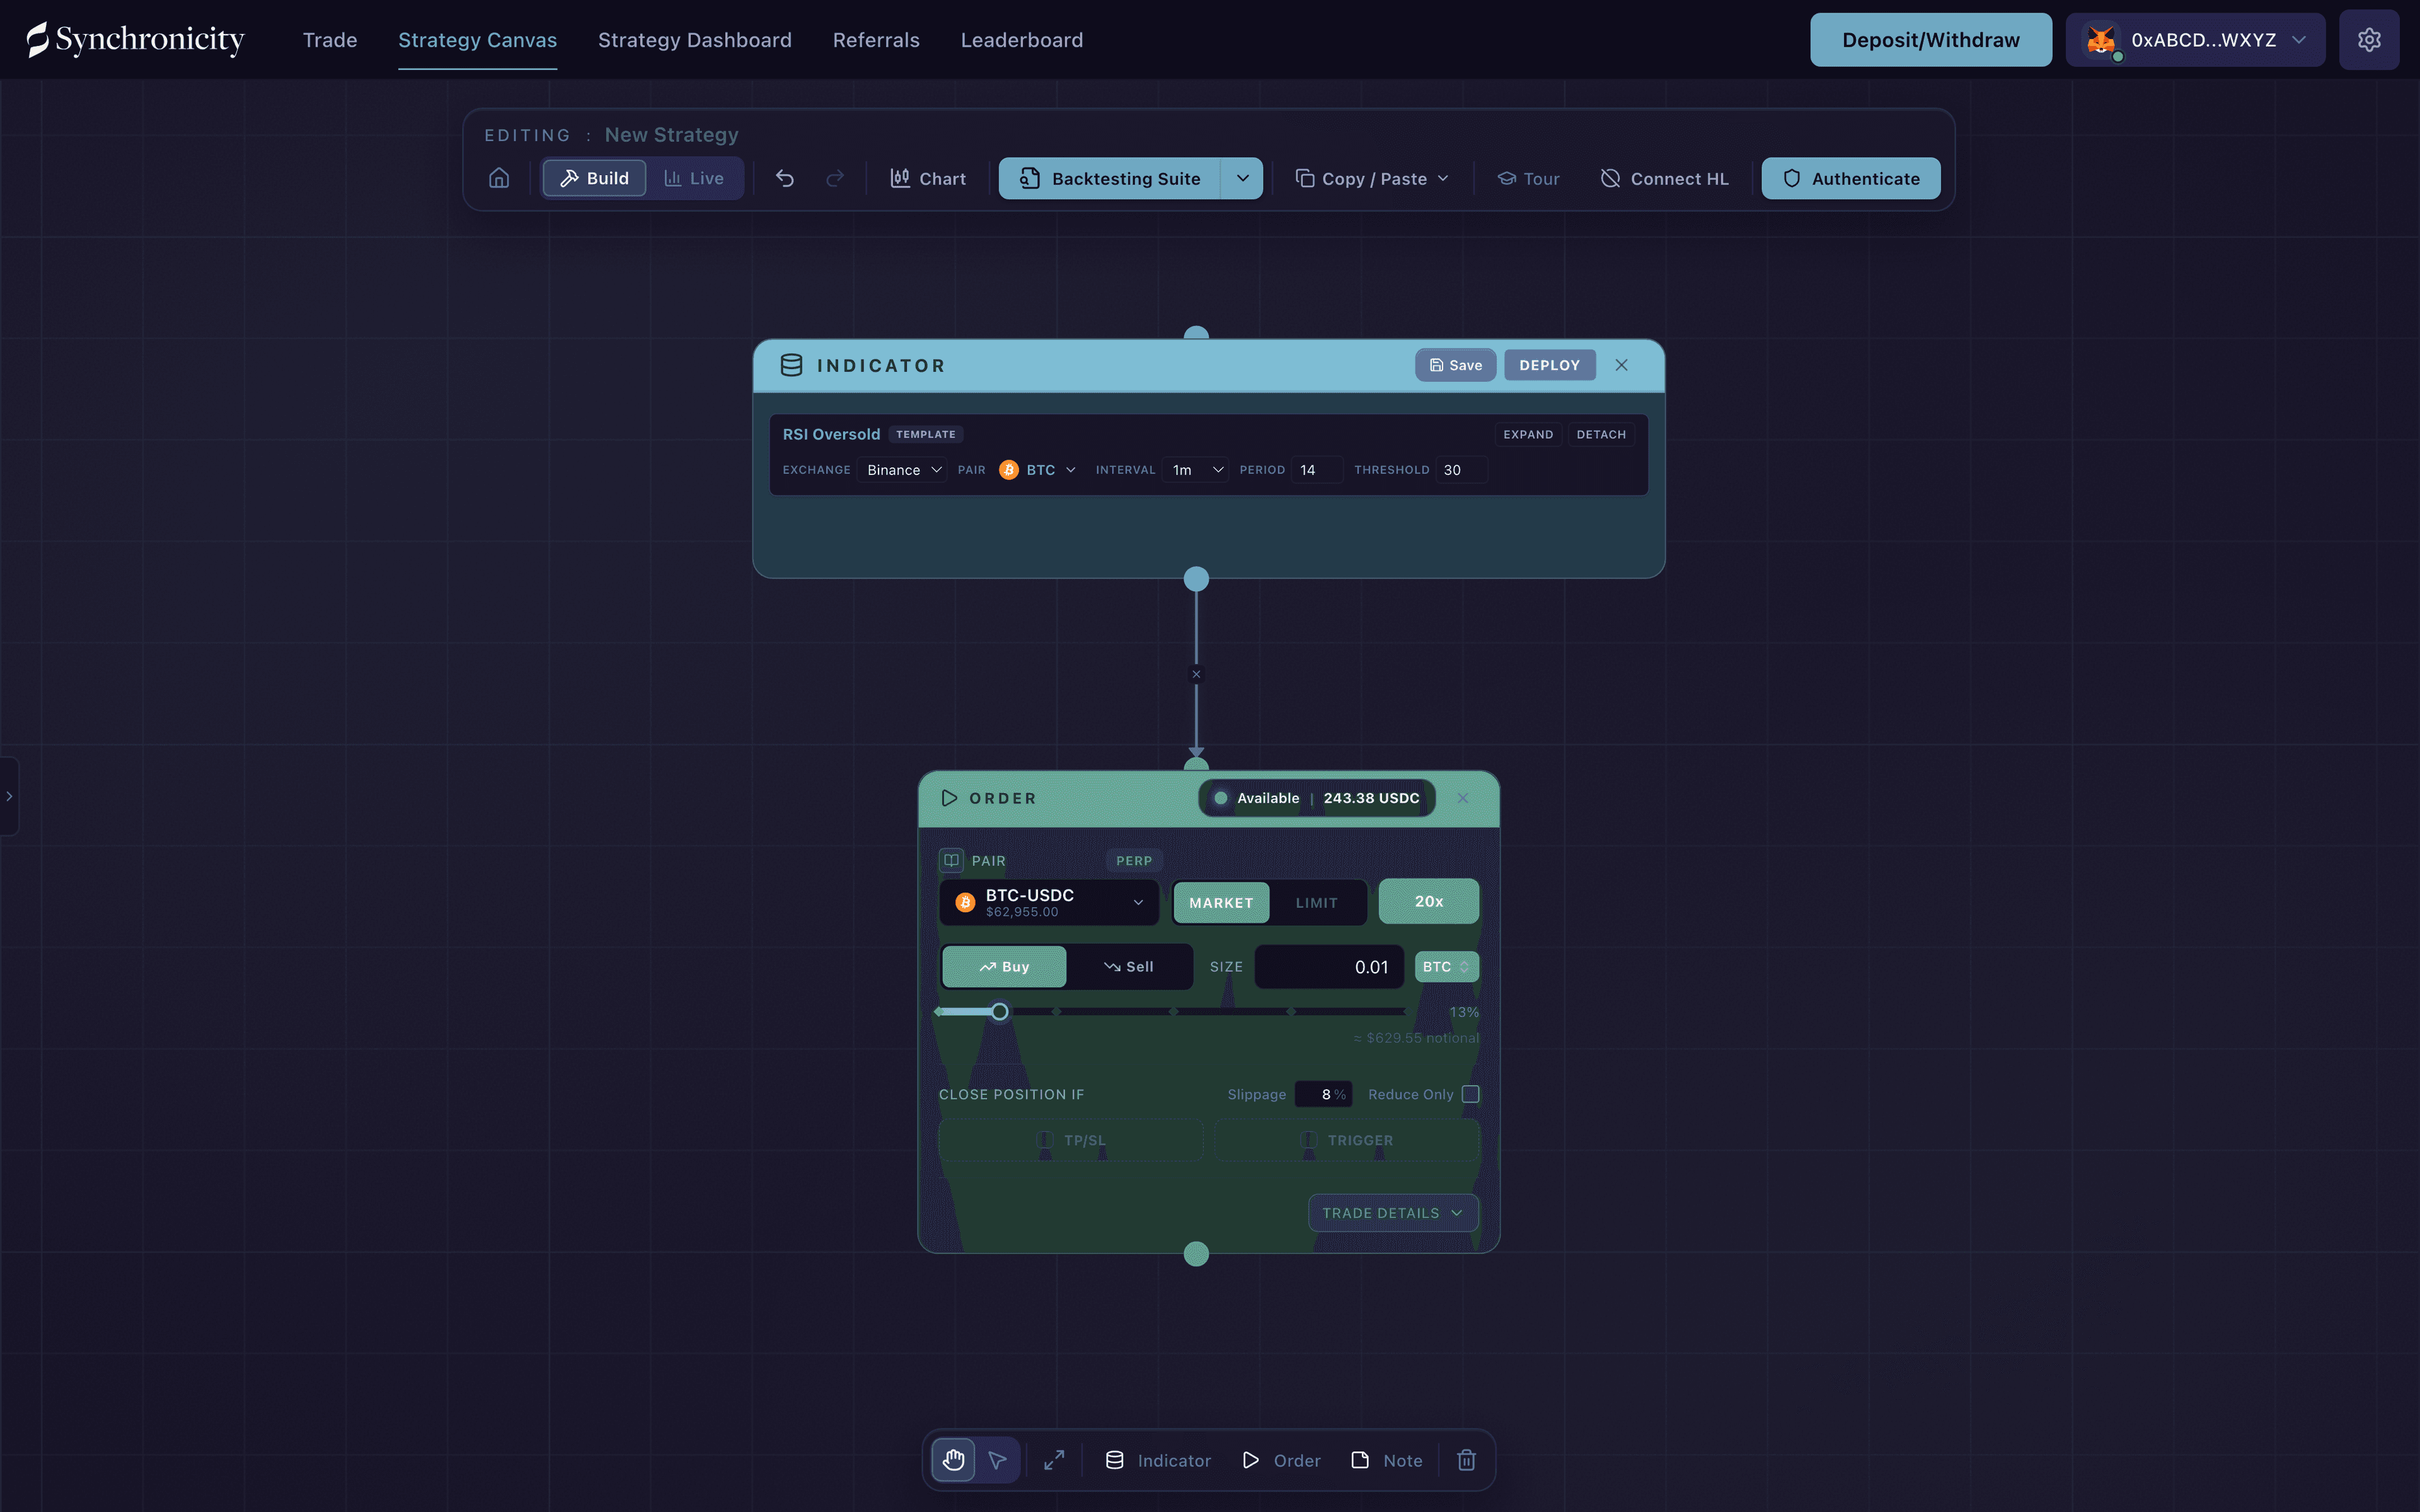
A new strategy on the canvas. Signac is ready on the right to build it with you.
On your first visit a welcome card offers a guided tour of the builder. Take it for a quick orientation, or dismiss it and start building.
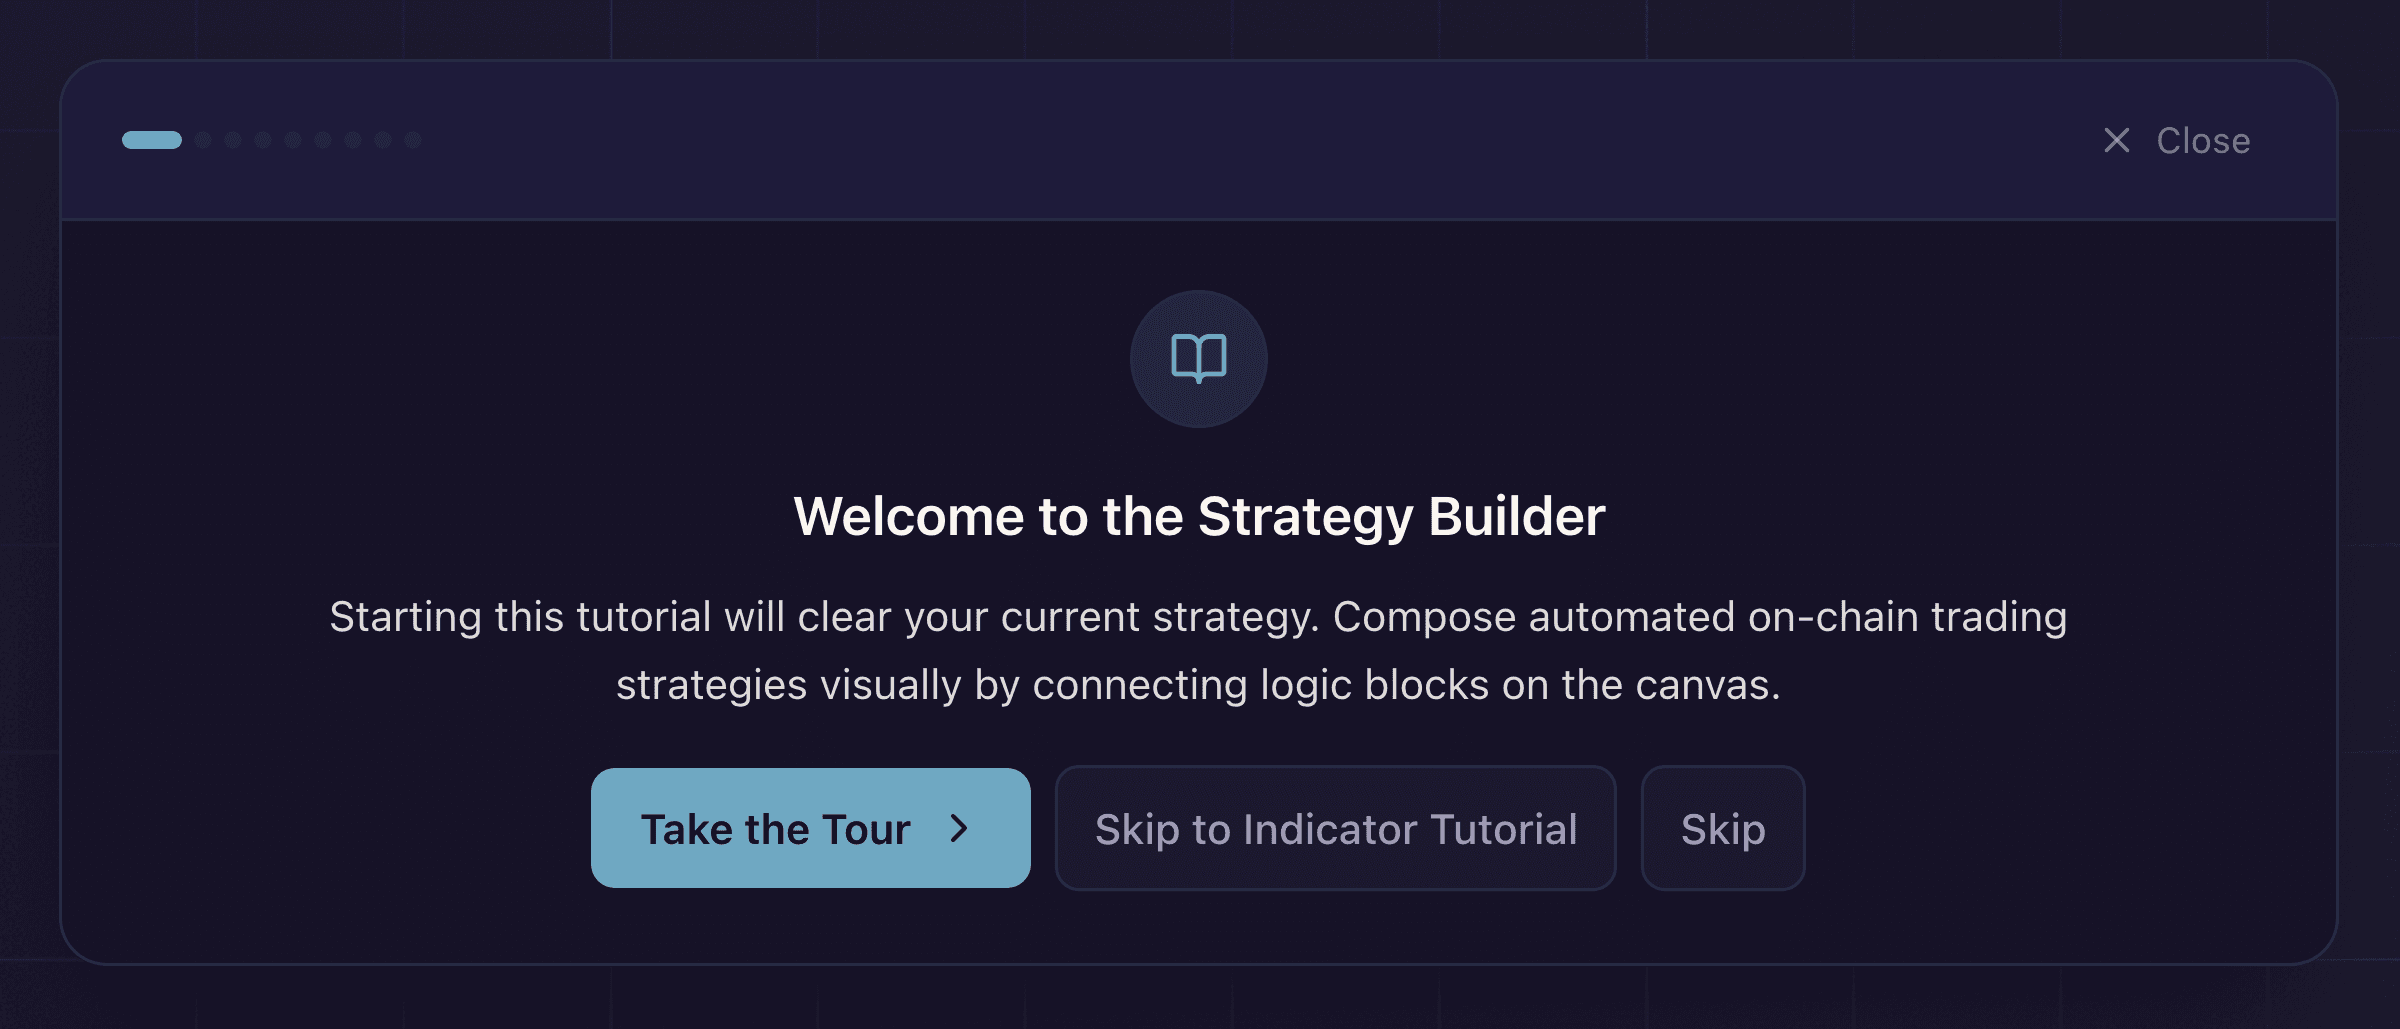
The welcome card. Take the Tour for a walkthrough, or close it to dive in.
Build your first strategy with Signac
The fastest path is to describe what you want and let Signac build it. Click Ask Signac on the canvas to open the chat, then state your idea in plain language. Signac reads your canvas, adds and wires the nodes, and fills in the conditions.
Try a prompt like this:
Enter a long on BTC when the 12-period EMA crosses above the 24-period EMA, size it at 5% of my balance, and close it at a 5% take profit or a 3% stop loss.
Signac turns that into a working flow on the canvas: an Indicator node that watches the EMA crossover, connected to a Buy Order node that opens the position and holds the exit. If anything is ambiguous, it asks before it builds. Everything it does stays visible, and you can undo any edit. For the full picture of what Signac can do, read Building with Signac.
Prefer to build by hand? Add an Indicator node, set one condition inside it (for example, EMA(12) > EMA(24)), then connect it to an Order node and configure the side, size, and exit. One Indicator joined to one Order is a complete strategy.
In plain words this reads as a “crosses above,” but inside the Indicator the entry condition compares two values with the > (greater than) operator. The two are not the same thing. Set Entry Conditions covers the difference and when to reach for a crossover template instead.
Treat the numbers above as an example rather than a recommendation.
Check the nodes
Before you let a strategy run, check that the logic does what you want. On mainnet these are real funds, so inspect the canvas the way you would inspect a position before you put it on.
A node is one step of your strategy on the canvas, and each one holds its own settings. Click a node to open its settings panel, where every field it carries is laid out for you to read and edit.
- Open the Indicator node and confirm the condition matches your intent: the right feed, the right comparison, the right threshold.
- Open the Order node and confirm the side, the size, the leverage, and the exit, whether that is a take profit and stop loss or a Trigger for an indicator-based close.
If it reads the way you meant it, you are ready to test it. If a single field surprises you, fix it now.
The canvas is the exact record of what will run. A wrong threshold or the wrong comparison direction does not error out. It will execute the logic you encode.
Name and save your strategy
Give the strategy a name before you go further, so the backtest you are about to run and the strategy you eventually deploy both carry a label you recognize. Type it into the strategy name field in the toolbar, where a new strategy starts as My Strategy.
There is no separate Save button in the builder. The canvas keeps your in-progress work while you move between pages of the app, but a browser refresh or closing the tab clears it. A strategy becomes a named entry in your dashboard when you deploy it, where its name and description are captured. Saving your work covers the full picture.
Backtest it
Click Backtesting Suite in the toolbar to replay the strategy against historical market data. An Evidence Card node lands on the canvas with the headline numbers. Click Open Evidence on it to open the suite, then Replay details for the simulated performance and the list of fills. Use it to catch logic errors and to compare setups across different market conditions.
A backtest approximates the past but it cannot make guarantees for future results. Do not rely on a positive backtest to assume the strategy will be successful. Read Backtesting a Strategy for what it does and does not account for, then weight its results accordingly.
Deploy it
When the strategy holds up, click Deploy in the toolbar. The builder checks the strategy, registers any price feeds your conditions need (an oracle is the trusted source that reports an asset’s price to the system), and submits it under your signed-in session, with no extra wallet prompt. Once it is accepted, the strategy appears in your dashboard with an Active status.
Live means the strategy runs on its own. It reads the market, acts when your conditions are met, places the order against your Hyperliquid balance, and manages the exit, all inside the limits you set, without you at the screen. The orders route to Hyperliquid mainnet, where they are actually filled and settled. You can open the strategy in read-only mode on the canvas at any time. To change an active strategy, cancel it, edit it, and deploy again. See Deploy a Strategy for the full flow.
Deploying puts the strategy live on Hyperliquid mainnet against your real balance. It trades real funds at real risk from the moment it is accepted. To rehearse the full flow risk-free first, do it on Practice on Testnet.
Watch how it behaves
Once deployed, your logic is being tested against a real market, so watch how it actually behaves. Open it from the dashboard, follow where it sits in the flow, and read its PnL (profit and loss) as it works.
Deploy small, watch what the market does to your logic, and let what you learn shape the next version. Monitor a Live Strategy covers what the dashboard shows and how to read it.