Create Custom Metrics
A custom metric is a formula you build once, name, and reuse. Instead of rebuilding the same math inside every Indicator, you define it as a metric and drop it into conditions as a single block. This is how you build things the toolbox does not offer out of the box, such as a custom spread between two markets.
When to use a metric
Reach for a metric when a value is too involved to rebuild by hand each time, or when you want the same calculation to stay consistent across several conditions. Common cases:
- A composite indicator the toolbox does not ship, or a variant of one it does. MACD and Bollinger Band are both single aggregator blocks now, so build a metric when you want a version they cannot express.
- A spread or ratio between two markets.
- A derived price you assemble yourself, such as an order-book midpoint built as
(Bid Price + Ask Price) / 2, that several conditions all reference.
Build a metric
The block palette on the left holds the feeds, aggregators, and operators you assemble a metric from.
Open the metric builder and assemble a formula from blocks:
- Data sources: any market data feed (mark price, candle close, bid/ask, funding, Rolling or Fixed VWAP, and so on).
- Aggregators: every aggregator the Indicator node offers, from SMA and EMA through to ADX, Supertrend, MACD, and Bollinger Band. The aggregator reference lists all of them.
- Arithmetic: add, subtract, multiply, divide.
- Comparison and logic:
>,<,≥,≤, AND, OR, NOT.
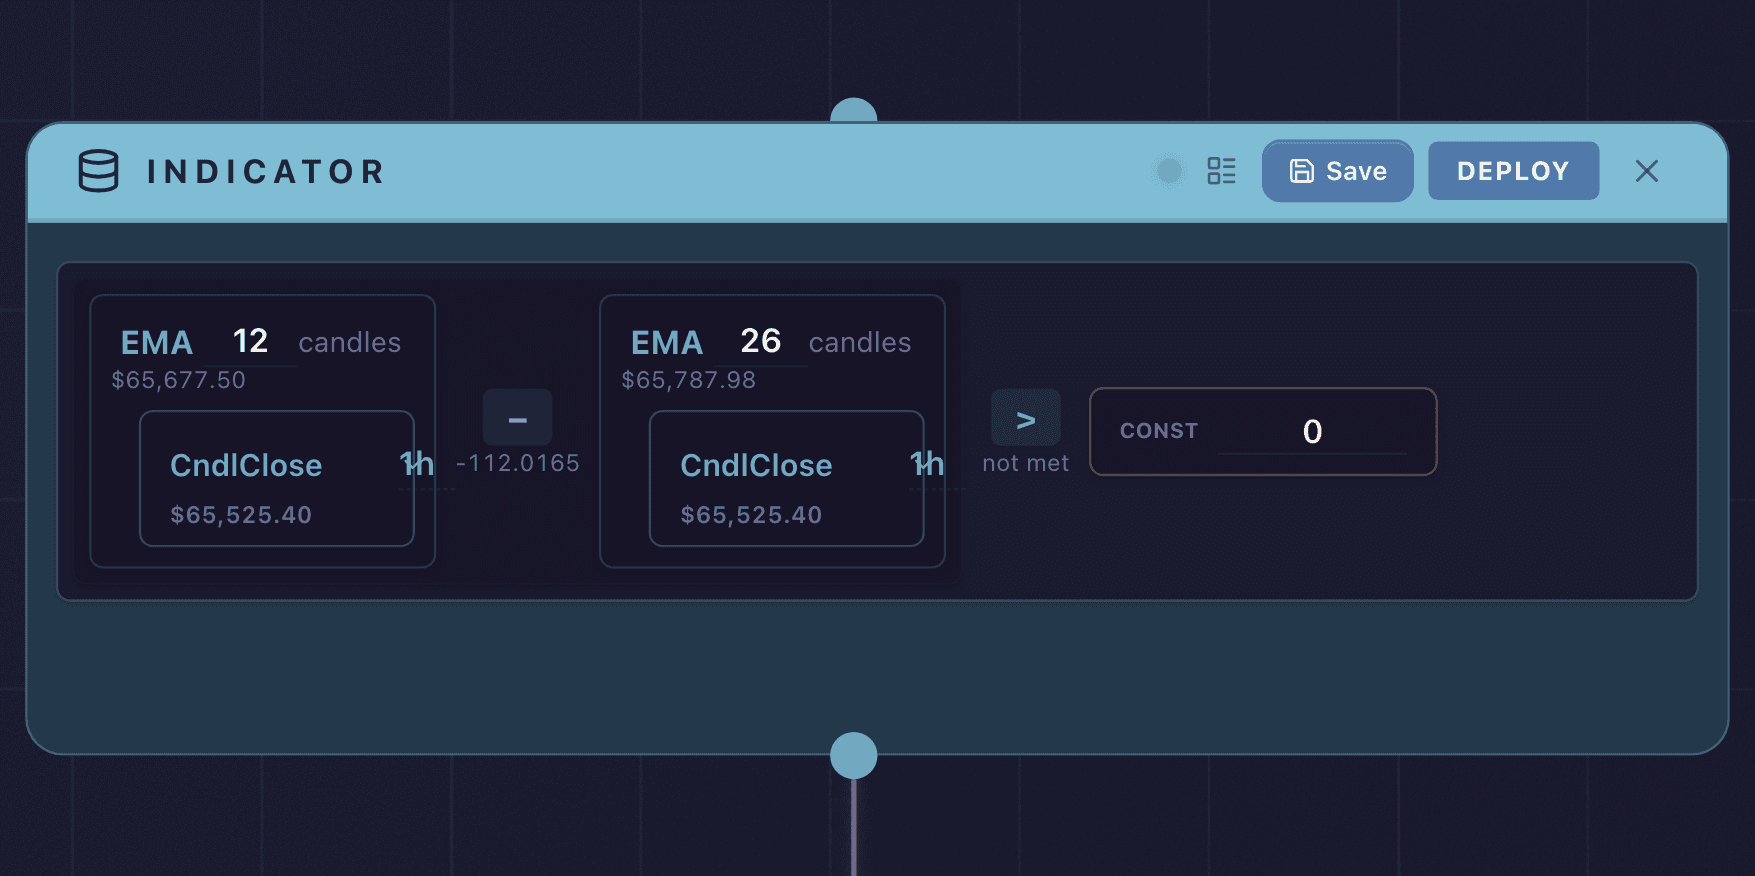
To save time, start from a built-in condition template (SMA Crossover, EMA Crossover, RSI Overbought, or RSI Oversold), then adjust it.
When the formula is complete:
- Set the output block. This is the block whose value the metric returns when you use it.
- Give the metric a clear name. This is what you will look for in the Library later.
- Save it. You need a connected account to save.
Name a metric for what it measures rather than the math inside it. BTC-ETH spread or Funding-adjusted mid reads better in a busy Library than metric 3, and it stays clear when you reuse it months later across strategies.
Use a metric in a condition
Saved metrics live in the toolbox Library, on the Metrics sub-tab. Open an Indicator (or an Order’s exit condition), find your metric in the Library, and click it to insert it as a single block. From there you compare it like any other value, for example BTC-ETH spread > 0.
When you deploy a strategy that uses a metric, the metric is registered as an oracle, a trusted live data source the running strategy reads from, so it can stream live values. Deployed metrics also appear in the Library, so you can reuse them across strategies. See Oracles for how the oracle system works.
The Library
The Library is the toolbox tab for things you reuse. It has two sub-tabs:
- Metrics: the custom metrics you have built, plus any you have deployed.
- Templates: the built-in condition templates (SMA Crossover, EMA Crossover, RSI Overbought, RSI Oversold) and any condition layouts you have saved yourself.
Both are insert-by-click, the same as the rest of the toolbox.