Using the Chart
The Strategy Builder has a built-in price chart you can open right on the canvas. It plots the market alongside your strategy’s indicators and marks where your conditions read true, so you can check your logic against real price action without leaving the builder.
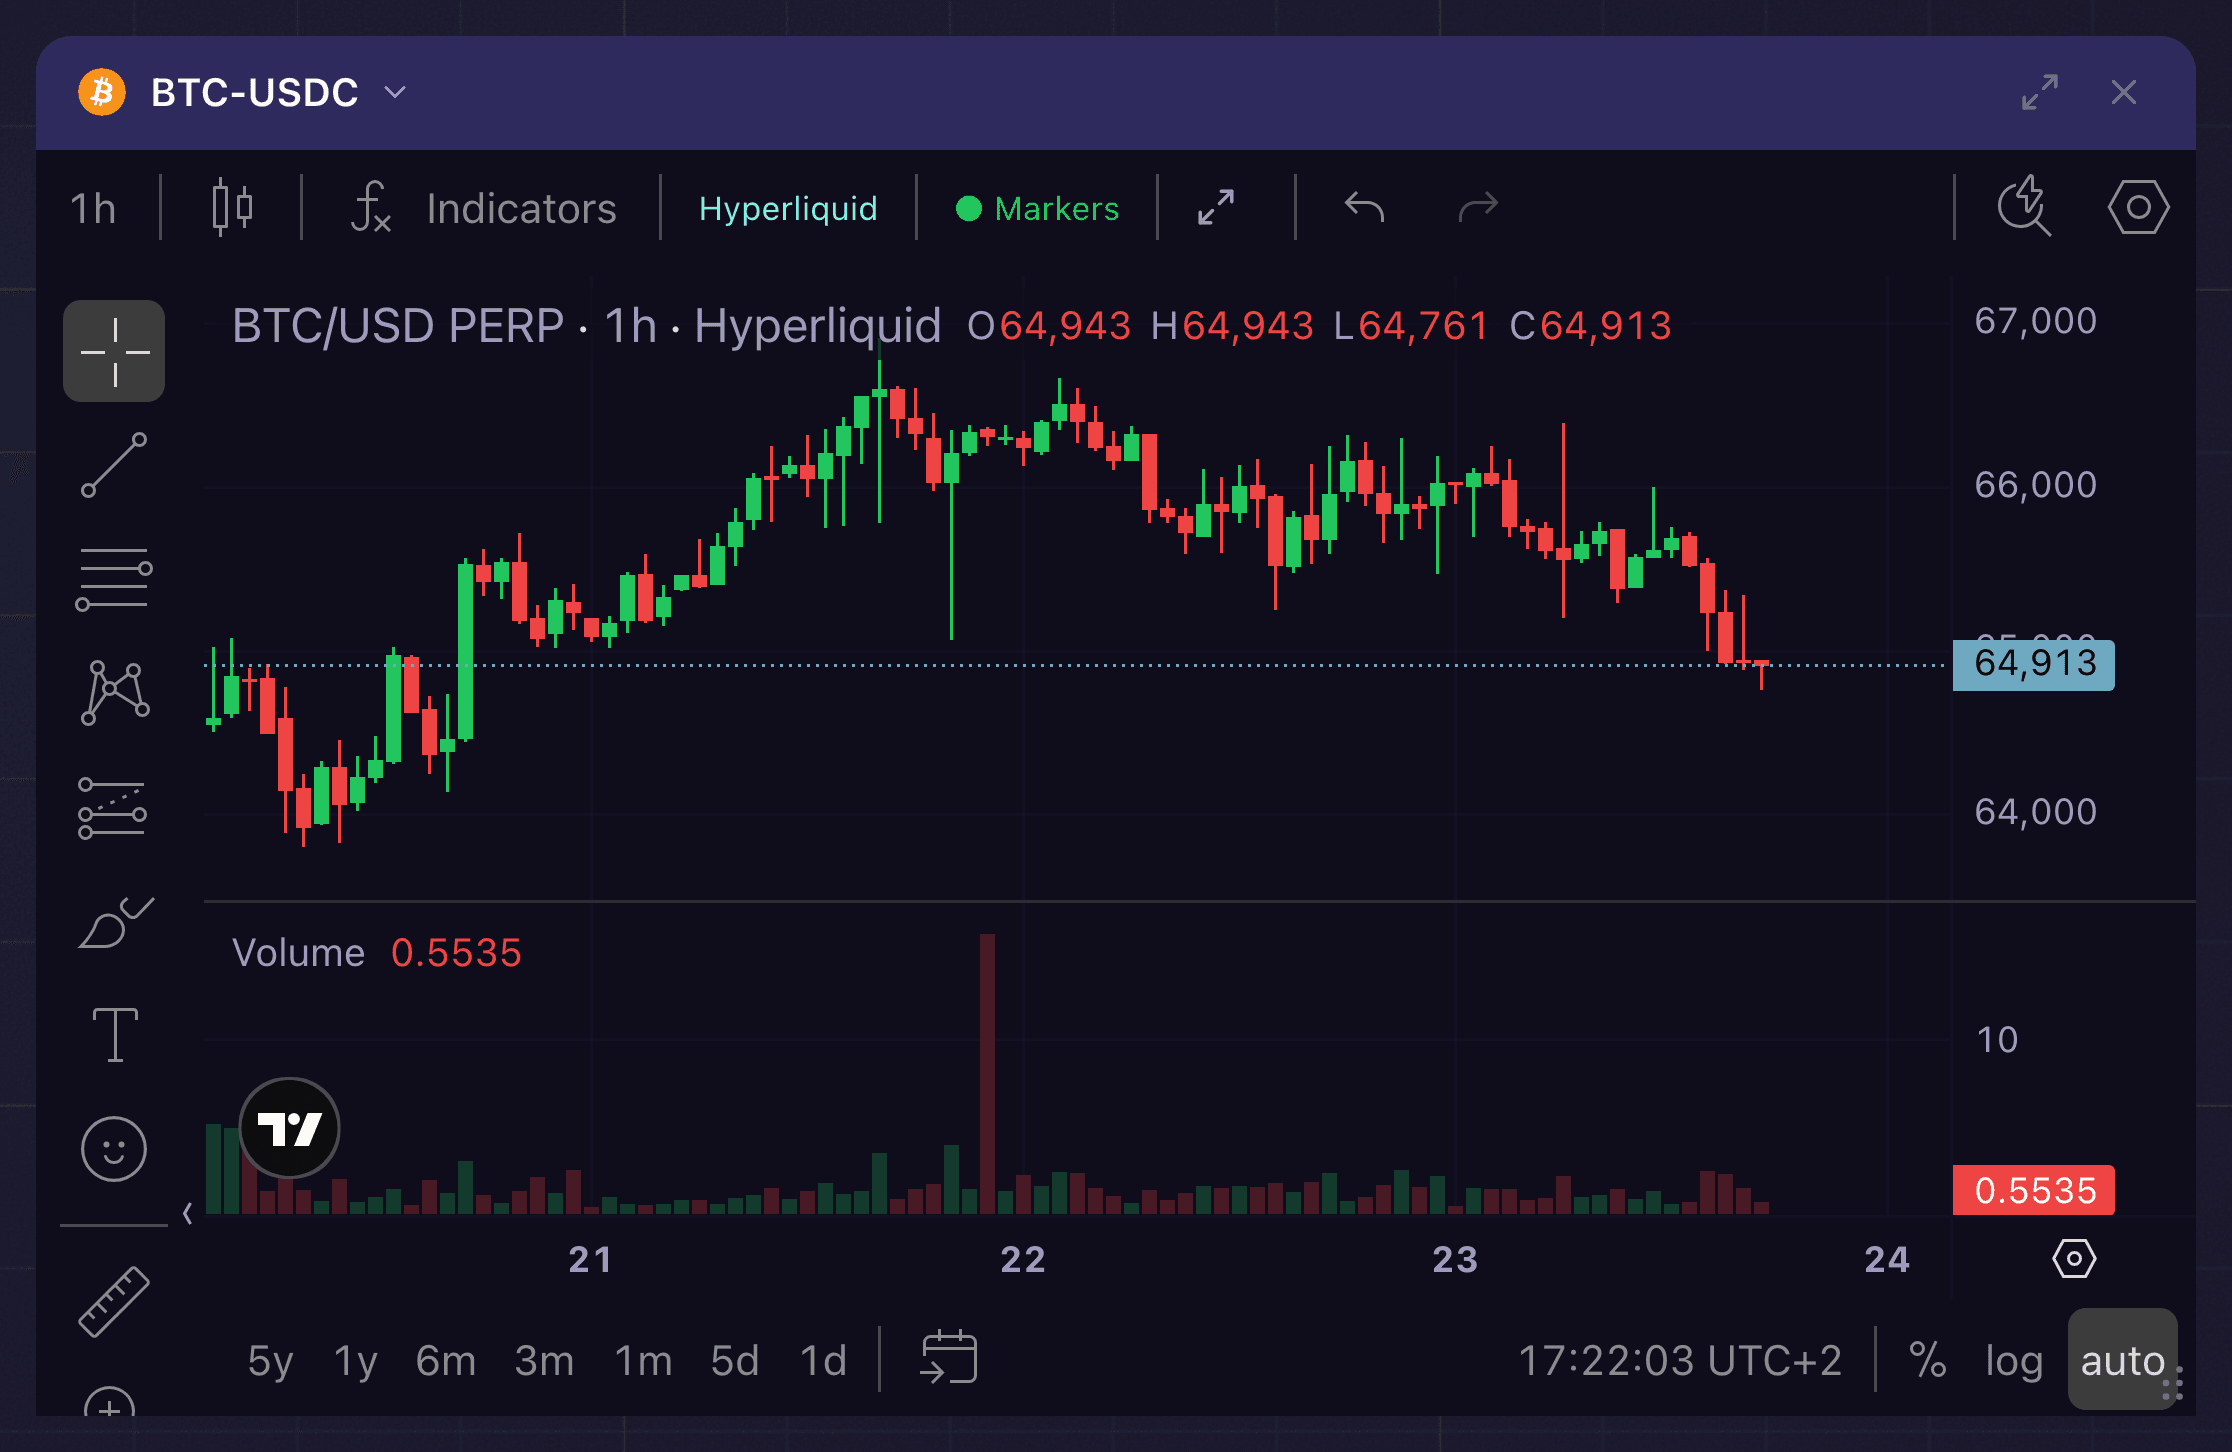
The chart panel on the canvas: candlesticks for the selected market and timeframe, a volume study below, and the header controls for indicators, data source, and condition markers.
Open and close the chart
Click the chart button in the floating toolbar, or press Shift+C. Press Shift+C again, or click the X on the chart, to close it.
The chart opens as a panel on the canvas. Drag its corner to resize it, and move it like any other node to keep it out of the way of your strategy.
When you want the price to fill the screen, take it fullscreen: double-click the chart’s header, or click the maximize button in that header. Press Esc to drop back to the windowed panel, or click the button again. Fullscreen helps when a condition marker lands somewhere odd and you want to see exactly where.
What it shows
- Candlesticks for the selected market and timeframe.
- Your indicators, drawn as overlay lines (studies) on the chart. The aggregators and custom metrics your strategy uses appear here so you can see them against price, with markers at the points where a condition reads true.
- Your open orders, drawn as price lines where your account’s resting orders sit.
Trade markers from a backtest are not drawn on this chart. They live on the equity curve inside the Backtest Result node.
You can switch the market and timeframe from the chart’s own controls.
What you are looking at is your own logic drawn on price. The conditions the chart overlays as studies are the ones you built inside the Indicator node, and those studies are only ever as broad as the data behind them. The reference covers every feed the chart can plot once a condition reads it.
How to use it
The chart is most useful for sanity-checking. After you build a condition, open the chart and confirm the indicator behaves the way you expect on recent price, and that the condition markers land where your logic should act. After a backtest, open the Backtest Result node to see where the simulated trades landed, and use this chart to understand why the conditions read true there. If a condition was met somewhere surprising, the chart usually shows you why.
The condition markers are the fastest way to catch a misread condition. If a marker lands somewhere the price never warranted a trade, the indicator is reading the market differently than you assumed. When a signal looks wrong, open the Indicator and check the math.