Strategy Builder Basics
The Strategy Builder lets you compose automated trading strategies on a visual canvas and deploy them as a flow of connected nodes. Instead of watching the market and placing orders by hand, an algorithmic trading strategy does this for you, acting on conditions you set in advance.
For example, a simple strategy might say:
When the 12-period EMA crosses above the 24-period EMA and RSI is below 30, buy 10 BTC at market price. Then close the position when RSI rises above 70.
That logic (the conditions, the order, and the exit) is exactly what you build in the Strategy Builder.
This page covers the core concepts behind how strategies work: nodes, connections, and the flow of logic from trigger to execution. By the end, you’ll know what each building block does and how they fit together.
The node canvas
Rather than writing code, you build strategies visually by connecting nodes on a canvas. Each node represents one step in your strategy’s logic.
The Strategy Builder. You compose on the canvas, with your strategies on the left and Signac on the right.
Two toolbars frame the canvas. The top toolbar holds the strategy-level actions, and the bottom toolbar holds the canvas controls.

The top toolbar: strategy actions from backtesting through to Deploy.

The bottom toolbar: pan and select, fit the view, add nodes, and delete.
A strategy is a flow of nodes. Each node does one job. When a node completes, execution moves to the next node.
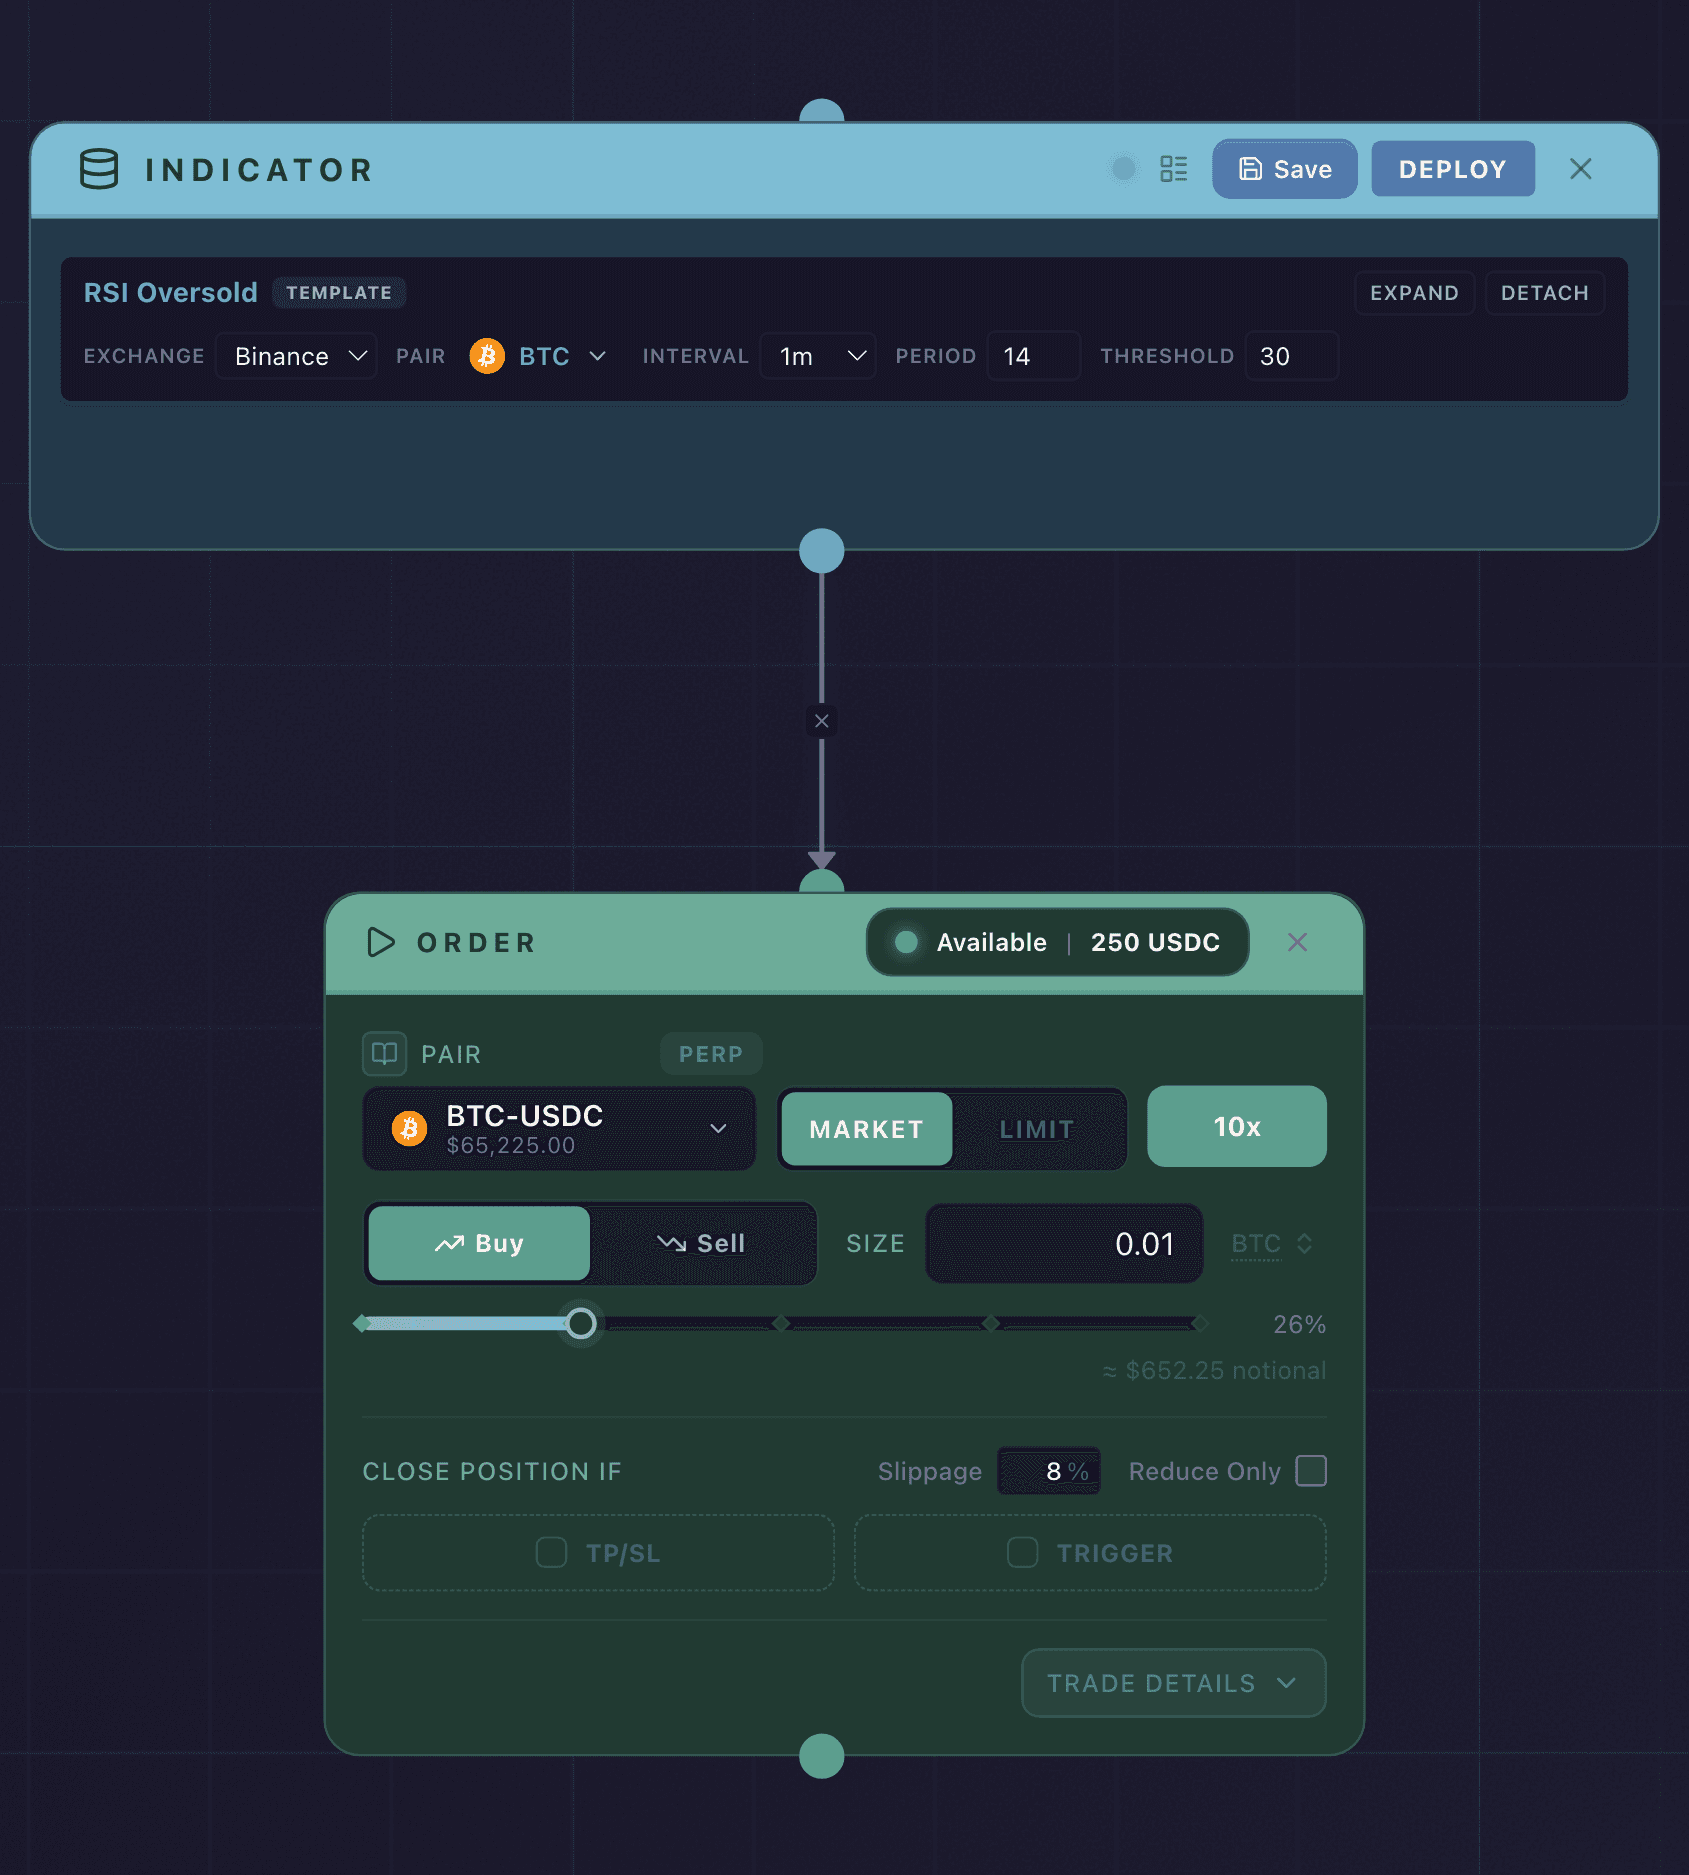
Strategies are built from two types of nodes: Indicator nodes, which check conditions and decide whether the flow should continue, and Order nodes, which perform actions like placing or closing orders.
There are only two execution node types: the Indicator and the Order. Everything about a condition lives inside one Indicator, and everything about a trade lives inside one Order. A complete strategy is often just one Indicator connected to one Order.
Nodes are color-coded by what they do:
| Color | Type | Purpose |
|---|---|---|
| 🔵 Blue | Indicator | Watches market data and triggers when conditions are met |
| 🟢 Green | Buy Order | Opens and closes long positions |
| 🔴 Red | Sell Order | Opens and closes short positions |
There is also a Notes node: a plain comment block you drop on the canvas to annotate your work. It has no connections and never runs. Use it to leave yourself a reason for a threshold or a reminder about what a branch is meant to do.
How a strategy flows
Every strategy follows the same basic pattern:
Evaluate → Execute
An Indicator node checks conditions. When they’re met, it passes control to an Order node, which places the trade. The Order node then monitors exit conditions and closes the position when they’re met.
A single entry-and-exit flow:
- 🔵 Indicator: Check Price > SMA(20)
- 🟢 Order: Open a long position and close based on Take-Profit
A multi-step flow:
- 🔵 Indicator: Check Price > SMA(20)
- 🟢 Order: Open a long position and close based on Take-Profit
- 🔵 Indicator: Check Price < SMA(20)
- 🔴 Order: Open a short position and close based on Take-Profit
When you run a strategy, execution starts at the first node and moves forward through the chain. Each node completes its job before passing control to the next.
Node types
🔵 Indicator
The Indicator node is the trigger for your strategy. The flow starts when the conditions inside it are satisfied.
It handles:
- Listening to live market data
- Applying indicators (EMA, SMA, RSI and more)
- Comparing data points
- Evaluating conditions (greater than, less than, AND / OR / NOT logic, and a confluence M of N vote, true when at least M of its N conditions agree)
One naming note: the reference docs call these EMA, SMA, and RSI blocks aggregators, to keep them distinct from the Indicator node that holds them. Read the Aggregators and Operators reference for a complete list of available aggregators and comparison operators.
Example: EMA(12) > EMA(24) AND RSI < 30
Every strategy starts with an Indicator node. If the condition is true, the flow continues. If not, nothing happens. The node keeps watching until conditions are met.
🟢🔴 Order
The Order node places the trade once an Indicator’s condition is met. The color reflects the direction: green for long, red for short.
It handles:
- Placing a market or limit order
- Setting size, leverage (borrowing to trade a position larger than your balance, so 10x means a $1,000 balance controls a $10,000 position), and slippage (how far the fill price is allowed to drift from the expected price before the order is rejected)
- Configuring take-profit and stop-loss targets
- Defining indicator-based closing conditions
Example: Market Buy 10 BTC, 10x leverage, 1% slippage, 25% take-profit, 10% stop-loss
An Order node executes trades the moment its conditions turn true on a deployed strategy. Leverage multiplies both gains and losses: at 10x, a 10% move against you wipes out your margin. Size every Order deliberately before you deploy.
Advanced patterns
Flows can go beyond the simple evaluate-then-execute sequence.
- Chained evaluations: Multiple Indicator nodes in sequence, each one running only if the previous passes. Useful when you want to stack conditions across different timeframes or signals before acting. Example:
Evaluate → Evaluate → Execute - Branching: An Indicator node can connect to multiple Order nodes, triggering them in parallel when conditions are met. See Using Multiple Assets.
- Cycles: A strategy can loop back and repeat the same sequence automatically. Useful for strategies that need to re-enter the market multiple times under the same logic. See Configure a Cycle.
Saving your work
The Strategy Builder has no separate Save button, and it does not store named strategies as you go. Three things stand in for it: naming the strategy, the canvas holding your work while you move around the app, and deploying.
Name it in the toolbar. Your strategy’s name is edited inline in the toolbar, where a new strategy starts as My Strategy. The name travels with the strategy into backtests and into your dashboard.
Your work survives in-app navigation. While you build, the canvas holds your in-progress strategy if you switch to another page of the app and come back. It does not survive a browser refresh or closing the tab, so deploy anything you want to keep before you leave.
Deploying is what saves it. A strategy becomes a named entry you can return to when you deploy it. At deploy the builder captures the name and an optional description, and the strategy then appears in your dashboard under the Strategies tab, alongside the Templates tab. From there you can open it read-only or clone it as a fresh draft.