What is the Strategy Builder?
Most automated trading tools make you write code or pay for heavy software, often both. The Strategy Builder removes that barrier. It’s an easy-to-use visual canvas where you build your trading logic as connected blocks, called nodes, then deploy it through Synchronicity, where it runs on its own. You build the strategy by drawing it instead of coding it, and once it is live you do not have to sit at the screen watching the market.
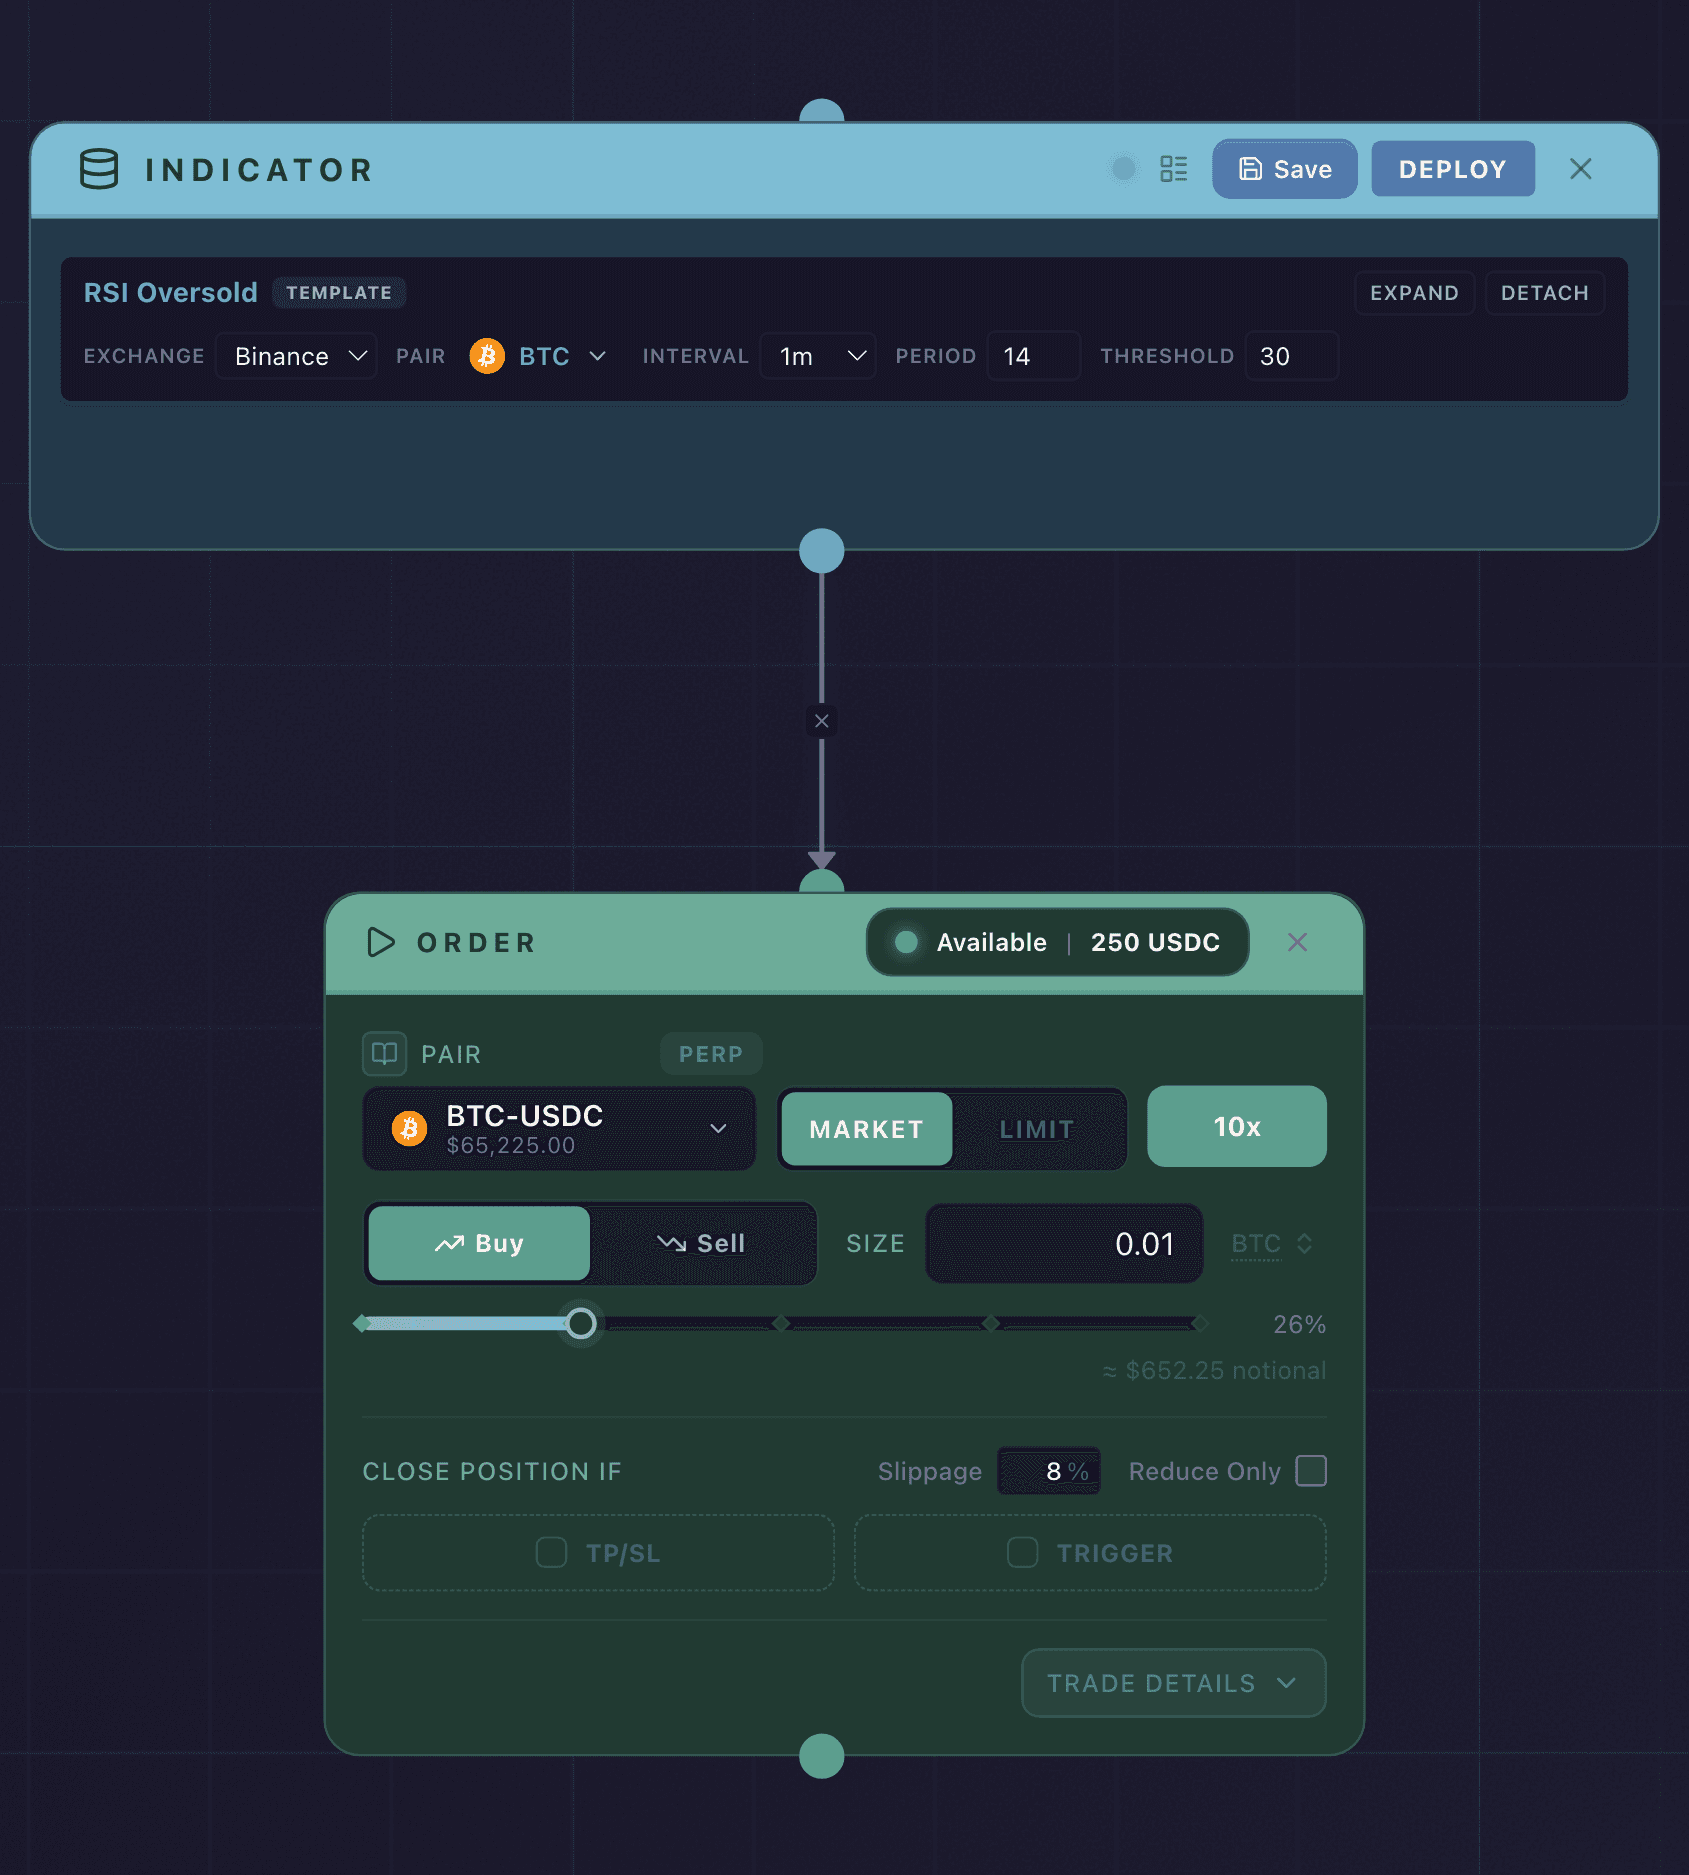
A complete strategy on the canvas: an Indicator node (RSI Oversold) connected to an Order node (Buy BTC). You build the logic by drawing it, node by node, instead of writing code.
What it does
A live strategy watches for the conditions you set, places orders when they’re met, and manages the exit on its own.
Your advantage comes from the logic you encode rather than how well you can code or how fast you can react to signals.
Prefer to learn by doing? The builder ships with an interactive tour. Click Take a tour in the top toolbar (the graduation-cap Tour button) to walk the canvas step by step, from the Indicator and Order nodes to deploy.
Synchronicity is where you compose, test, and deploy the strategy. The trades themselves are placed and settled on Hyperliquid. See Connect to Hyperliquid.
Why a canvas instead of a black-box agent
Most automated trading tools hide the logic. You describe what you want, an AI generates a strategy, and it runs. The reasoning stays sealed, so you cannot verify what it did or why. You are left trusting the AI with your funds.
The Strategy Builder keeps the logic on the table. Every condition, every connection, every exit rule lives on a canvas you can read at a glance. Before you deploy, you know what the strategy will do. After it runs, you know what it did and where. Signac, the AI assistant, helps you compose and edit, and the strategy stays yours to inspect and control the whole way.
What you can build
The Strategy Builder supports a range of strategy patterns:
- Entry-and-exit strategies: An Indicator node watches for your entry condition, then an Order node opens the position and holds its own exit (a take profit, a stop loss, or an indicator-based close).
- Multi-step flows: Chain several Indicator and Order nodes in sequence to require conditions in order, or fan one Indicator out to several Orders to act in multiple markets at once.
- Repeating strategies: Use cycles (a connection that loops the strategy back to re-enter automatically) to run the same logic again once a position closes.
Inside a condition you can use familiar indicators like moving averages (SMA and EMA), RSI, MACD, and Bollinger Bands, alongside a deeper set of statistical tools (such as Z-Score, standard deviation, and ATR) for mean-reversion and volatility strategies, all set up visually.
You do not need to know every indicator to start. One Indicator node joined to one Order node is already a complete strategy. When you want the full list, the Data Feeds and Aggregators and Operators references have it.
Next steps
Building is the fun part, but first you connect the account that will trade. Continue to Connect to Hyperliquid to link and fund the account a strategy deploys to.
If you would rather understand the nodes, connections, and flow before you build, read Strategy Builder Basics first, then come back to connect.
Building the strategy is open to anyone. Deploying it is gated while Synchronicity admits traders in waves, so read how to get access to Synchronicity before you plan a launch date. For the whole sequence in order, the full Get Started path runs from access and account setup through to a strategy running live.